
Executive & finance
Board-ready KPIs, variance views, and drill paths that answer “why” without another ad hoc request.
NASBIX TECHNOLOGIES
Semantic models, KPI definitions everyone shares, and role-based dashboards in Power BI, Looker, Metabase, or embedded in your product—built on governed data from our Karachi delivery center.
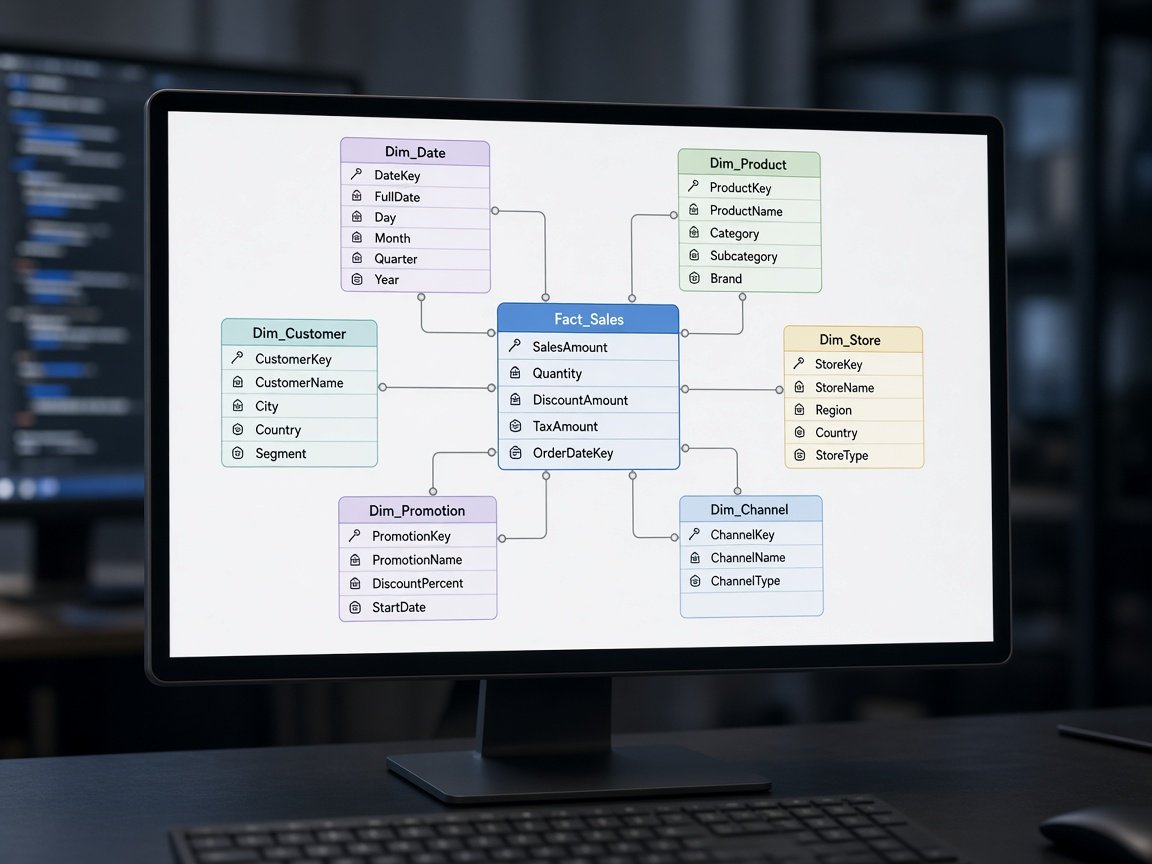
BI fails when every team exports CSVs, KPIs are defined three ways, and dashboards break silently after a schema change. NASBIX builds a metrics layer on your warehouse—documented SQL or semantic models—then dashboards and explore experiences that match how executives and operators actually decide.
We implement on Snowflake, BigQuery, Redshift, or Postgres marts delivered by data engineering, and visualize in Power BI, Looker, Tableau, Metabase, or custom embedded charts in your SaaS. Connect to ML when predictions belong beside historical KPIs.
First BI platform, dashboard refresh, and rescue when nobody trusts the numbers.
Board-ready KPIs, variance views, and drill paths that answer “why” without another ad hoc request.
SLA, throughput, and queue dashboards tied to the same definitions engineering uses.
Funnels, cohorts, and campaign performance aligned with product analytics where both exist.
From modeled data to dashboards people open every Monday—not shelfware.
Central definitions for KPIs, dimensions, and grain—dbt metrics, LookML, or documented SQL views.
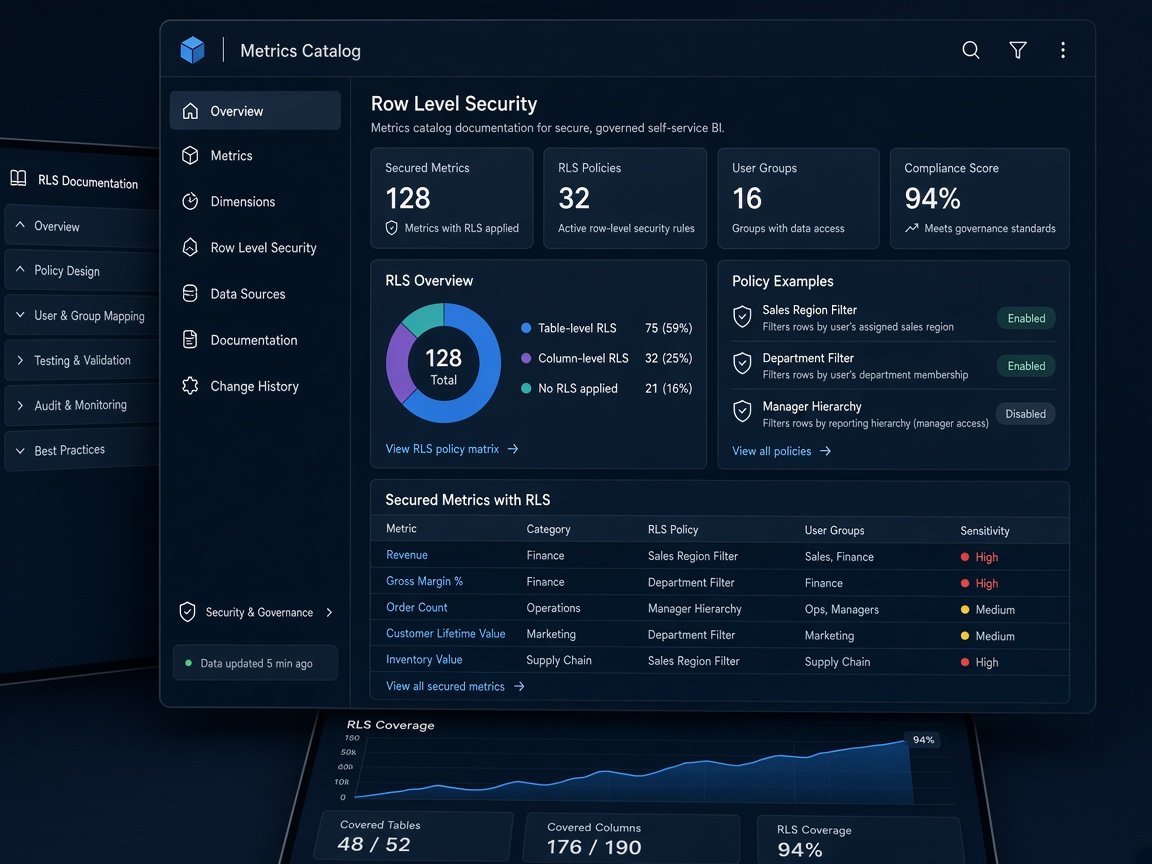
Role-based executive, team, and operational views with consistent filters and drill-through.
Governed datasets so analysts explore without breaking production or duplicating logic.
In-app analytics for customers or partners—multi-tenant security and theming when product requires it.
Threshold alerts, scheduled PDFs, and Slack/email hooks when metrics move unexpectedly.
Playbooks, office hours, and dashboard catalogs so BI investment gets used after launch.
We do not paint charts on broken ETL—when marts are missing, we scope data work explicitly or partner with your internal platform team.
Align definitions first, ship highest-value dashboards early, expand domains iteratively.
Fixed-scope KPI set and leadership views on agreed warehouse tables.
Semantic layer, multiple domains, governance, and self-serve for analysts.
Customer-facing reporting inside your product with tenant isolation and branding.
Ongoing dashboard requests, metric updates, and performance tuning each month.
Pipelines, ML, and innovation built on metrics you can defend.